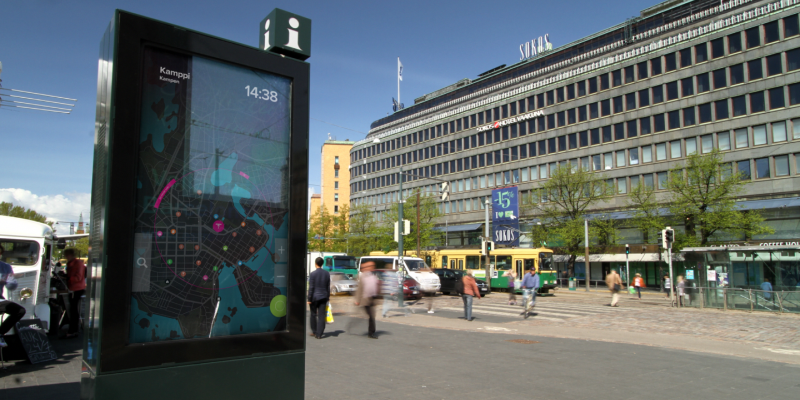
Urbanflow is an interactive information service for urban screens, designed initially for the context of Helsinki, where a set of large interactive touchscreens had been installed across the city center, and promptly used to display primarily non-interactive advertising content, and a static map. It was created in 2010/11, as a collaboration between Urbanscale and Nordkapp.
We started with a simple, even obvious question: what might cities do with such situated screens that would be generate value for itself, its citizens and visitors, given the wealth of information it has available? Urbanflow began with the underlying belief that a screen of this type, in this context, requires a different interaction model than one based on "apps", transposed directly from smartphones and tablets. It was a manifestation of Urbanscale's philosophy that whether municipal, commercial or citizen-generated, data only becomes understandable and usefully actionable only when it’s been designed: when it’s been couched in carefully-considered cartography, iconography, typography and language.
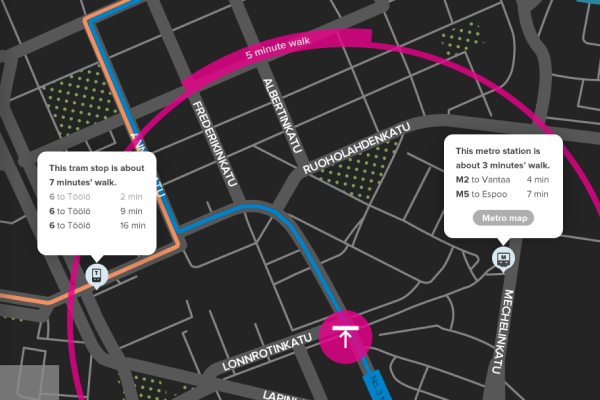
The entire map is interactive, with search layered on topTransit data is a first-class citizen of the Urbanflow experience, always displayed with an understanding of context.
In Urbanflow, we brought that craft to bear on a number of map-based functions. These are things that we thought ought to be useful for anyone encountering these screens as they move through the city — quite possibly without smartphones and/or local data plans of their own, or as a complement to them, given their very different scale and the fact that they are just... there.
Journey planning and wayfinding/wayshowing. The ability to locate and orient yourself in the surrounding environment, then plan or just continue on your way from your current location to any other location, is central to the idea of Urbanflow. The map is designed to be pedestrian- and transit- first, in contrast to many automobile-centric digital maps, and be augmented by real time transit data, displayed through the lens of what matters to you in your current location. Each map, by default, shows a walking radius of 5 minutes centered on the you-are-here marker, and the map itself is "heads up" - in other words, "up" on the map is straight ahead, not north. Urbanflow was first considered in the context of Helsinki, followed by Chicago, so we were also interested in integrating the underground and through-building passageways that provide pedestrians with alternatives to the brutal outdoors during the winter months in those cities. The design choices made on the cartography itself are heavily influenced by the work of City ID and their partners' Legible City work, first in Bristol, then in the Legible London system, and more recently with WalkNYC in New York City.
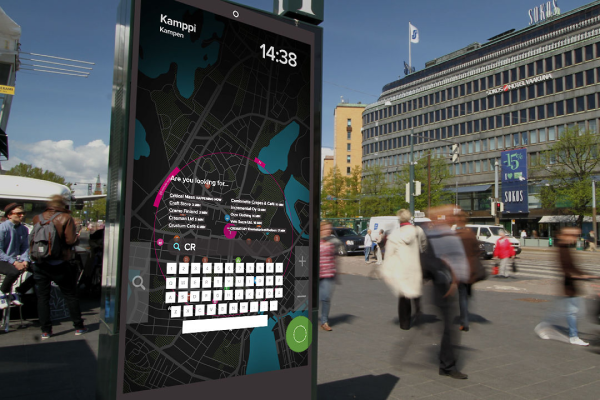
Service discovery. You should be able to discover the existence and location of places and services of interest to you, whether that means 24-hour medical care, a shop selling vintage clothing, an exceptional restaurant, a gallery featuring the best local photography, or simply a good place for a long, thoughtful stroll. We envisaged that those listings should be presented together with data such as municipal health-and-cleanliness ratings, user reviews, and opening times for establishments. Tapping on any location renders a walking (or walking and transit) route to that place, together with any key information.
Citizen responsiveness. We saw no reason why a public interface of this type shouldn't also allow passers-by to report the existence and severity of faults, breakdowns and damage to municipal services and infrastructure in the vicinity, directly to the bodies empowered to deal with them. Transparency about what issues are already known and their status, are also displayed on the map.
Reads on ambient data. We explored what it would mean to have, on the same basemap as journey planning and service discovery, access to carefully considered data visualisations such as traffic, ambient noise levels and air quality, with an eye towards this being an extensible framework.
Team
This work was conducted while at Urbanscale with Adam Greenfield and Jeff Kirsch in 2010/2011, together with the wonderful team at Nordkapp led by Sami Niemelä, and with the support of Helsinki's Forum Virium.
Appendix
Project microsite, with detailed description of features and interaction model